Thread: Winols ecu tuning software…Map changes from pd 130 bhp to pd 150 bhp
REMAP PD 130 TO PD 150
THIS PAGE DOES NOT TELL YOU HOW TO REMAP A PD 130 TO 150 BHP.
IT IS A COMPARISON OF SEAT LEON PD 130 & PD 150 FUEL AND TURBO MAPS.
THIS COMPARISON SHOWS HOW SEAT CHANGED THE 130 BHP MAPS FOR THE 150 BHP ECU.
IT IS UP TO YOU WHAT YOU DO WITH THIS INFORMATION.
AXES ARE BOLD.
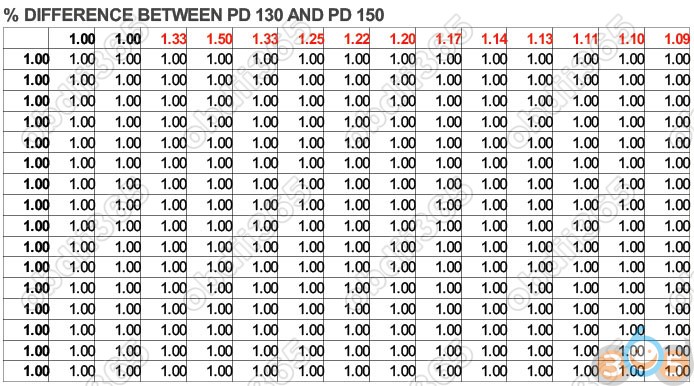
% DIFFERENCE TABLES SHOW PERCENTAGE DIFFERENCE BETWEEN 130 BHP AND 150 BHP.
BLACK MEANS VALUES ARE UNCHANGED (1.00).
RED MEANS VALUES INCREASED, BLUE MEANS VALUES DECREASED.
1.00 MEANS NO DIFFERENCE, LESS THAN 1.00 MEANS 150 BHP VALUE IS LOWER, MORE THAN 1.00 MEANS 150 BHP
VALUE IS HIGHER.
AXES ARE X – ACROSS AND Y – DOWN. Z – AXIS IS TABLE DATA.
(ALL DATA IS RAW HEXDUMP DATA. NO FACTORS OR OFFSETS.)
DRIVERS WISH MAPS
First row (x) is Accelerator pedal. (0 – 10000) Multiply by 0.01 to see it as a percentage. (10,000 x 0.01 = 100
First column (Y) is engine RPM. (0 – 5355 rpm)
Chart data (Z) is Injection Quantity (0 – 7000) Multiply by 0.01 to see it as mg/stroke. (7000 x 0.01 = 70 mg/stroke)
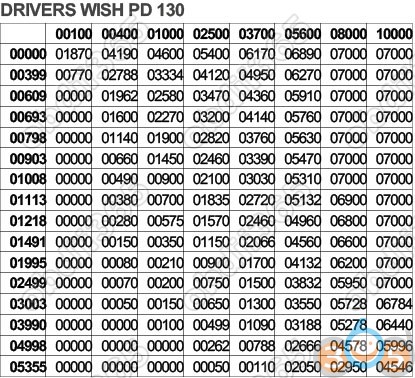
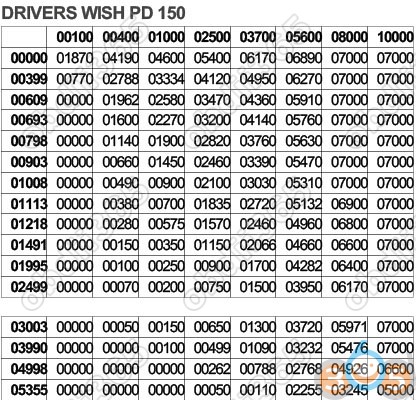
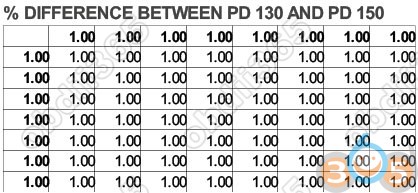

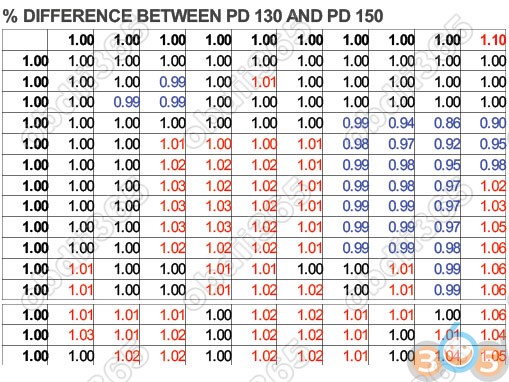
The Percentage difference chart shows that the axes are unchanged between 130 and 150 ECU’s.
The Injection Quantity (I.Q) output is increased between 1 and 10 percent at high pedal % request and high RPM. (Shown as red numbers)
Note that the 150 does not request more fuel. (maximum is 70 mg/stroke for both 130 and 150). It does request I.Q values, slightly higher and
slightly earlier than the 130.
So the limiting I.Q factor for the PD 130 and 150, via Drivers wish is 70 mg/stroke.
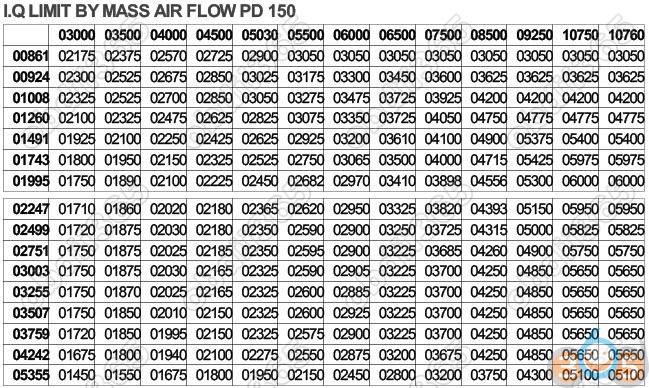
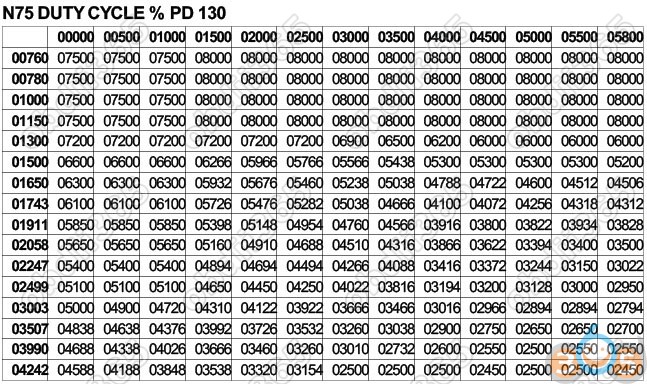
I.Q LIMIT BY MASS AIR FLOW (MAF) known as SMOKE LIMITER
First row (X) is Mass Air Flow (MAF) (3000 – 10510). Multiply by 0.1 to see it as mg/stroke. (10510 x 0.1 = 1051 mbars)
First column (Y) is engine RPM. (861 – 5355)
Chart data (Z) is Injection Quantity (I.Q) (0 – 6000) Multiply by 0.01 to see it as mg/stroke. (6000 x 0.01 = 60 mg/stroke)
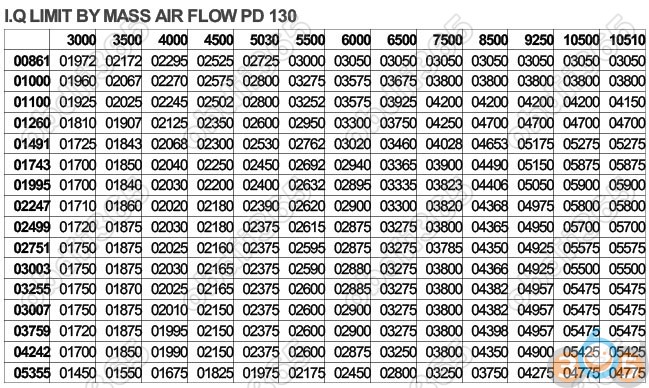
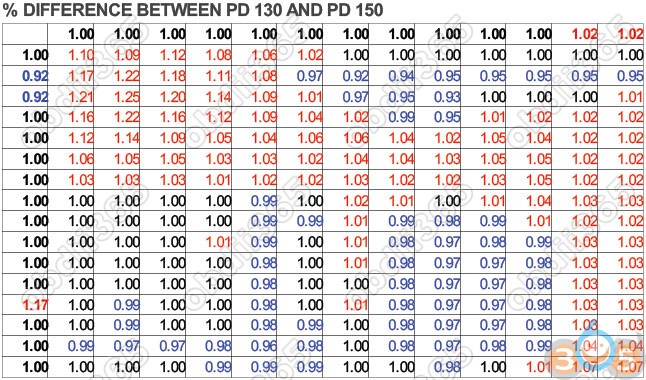
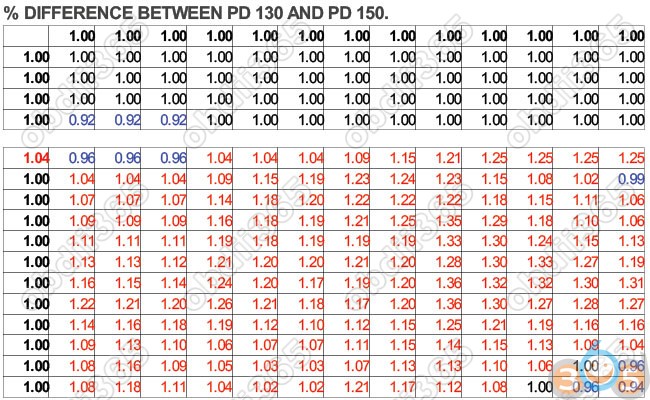
The % difference chart shows that the axes are slightly changed. The Y axis (RPM) is very slightly altered and can probably be left as the 130
one.
The X axis is alterd at the upper end to allow for higher Mass Air Flow rate.
Overall you can see that the 150 has an increased I.Q at low rpm and low Mass Air Flow rate, but not at high rpm and low Mass Air Flow rate.
The main change is to have higher I.Q at middle to high rpm when the Mass Air flow is high. (Last two columns)
On the 130 map the maximum I.Q is limited to 59 mg/stroke by the MAF.
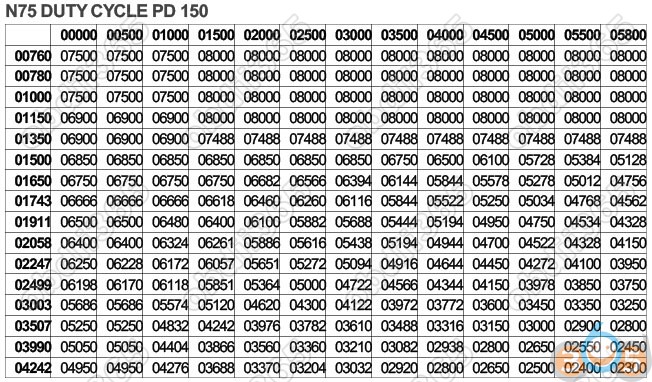
On the 150 map the maximum I.Q is limited to 60 mg/stroke.
So the I.Q difference between 130 and 150 is only 1 mg/stroke.
Even if the Drivers wish requests an I.Q of 70 mg/stroke, it will be limited by the Mass Air Flow to 60 mg/stroke maximum.
TORQUE LIMITING MAPS
First row (X) is engine RPM. (0 – 5355 rpm)
First column (Y) is Atmospheric Air Pressure (500 – 1000 mbar)
Chart data (Z) is Injection Quantity (0 – 5100) Multiply by 0.01 to see it as mg/stroke. (5600 X 0.01 = 56 mg/stroke)
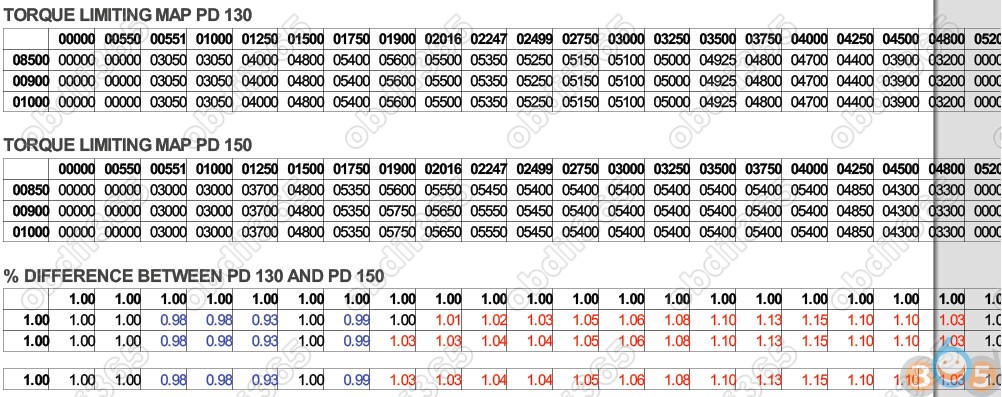
The Percentage difference chart shows that the axes are unchanged between 130 and 150 ECU’s
The torque limiter is Atmospheric Air Pressure dependent (First column , Y – axis). It is based on three Air pressures, 850, 900 and 1000
mbars.
Normal sea level air pressure is roughly 1000 mbars so the ecu ‘s limiting will normally be based on the last row. The other rows are designed
to reduce I.Q and indirectly turbo speed at lower air pressure.
This is to stop the turbo over-reving in thin air and destroying itself. For this reason the figures in the first row are always lower than the figures
in the last row.
At all pressures the I.Q output for the 150 is increased over the 130 from about 1900 RPM. This is the point at which the turbocharger starts to
blow.
There is no point in having a higher I.Q below this 1900 RPM as their will not be enough air available.
The 130 has a peak I.Q of 56 mg/stroke. This only increase to a maximum of 57.50 mg/stroke for the 150.
So the 150 injects 3 to 10% more fuel per stroke than the 130.
The Torque map limiting the maximum I.Q to 57.50 mg/stroke.
Even if the Drivers wish requests an I.Q of 70 mg/stroke, it will be limited by the Mass Air Flow to 60 mg/stroke maximum and
this will then be limited by the Torque limiter to a maximum of 57.50 mg/stroke.
So to remap a PD 130 to 150 you can see that;
You don’t need to change the Drivers wish. It already requests up to 70 mg/stroke fuel, which is plenty.
You can change the MAF limiting (smoke) map to give more I.Q at high Mass Air Flow rates and a little bit at low MAF & low rpm to make the
engine pull more strongly at low rpm.
Beware increasing I.Q too much at low Mass Air Flow. If you do, you will get alot of black smoke.
You can change the Torque limiting map to allow more I.Q from about 1900 rpm. The peak I.Q must reduce slightly as RPM rise and the final
column must be 0000.
You should make sure that I.Q is first limited by Drivers wish (Highest I.Q). Next I.Q should be limited by MAF (Lower than drivers wish). Finally
I.Q should be limited by the Torque limiter. (Lowest I.Q)
Changing Injection Quantity is not a simple thing. The engine ecu contains calibration maps which turn requested I.Q into actual fuel injection.
The I.Q is made up of two main factors.
DURATION of injection and Start of Injection (SOI). So a requested I.Q must be calibrated as a set duration of injection with a set starting
point.
Duration maps (0 – 5) for SEAT pd 130 and 150 are identical, which means that they can cope with the change of I.Q needed to go from 130
converted by Web2PDFConvert.com
Duration maps (0 – 5) for SEAT pd 130 and 150 are identical, which means that they can cope with the change of I.Q needed to go from 130
bhp to 150 bhp.
BUT
Start of Injection maps (TEN maps) are different for the pd 130 and pd 150 engines. The example below is for SOI 0. It shows very little
change and is similar to the other 9 SOI maps. To save space I am only showing SOI 0 on this page. All 10 can be seen in the excel
spreadsheet download at the bottom of the page.
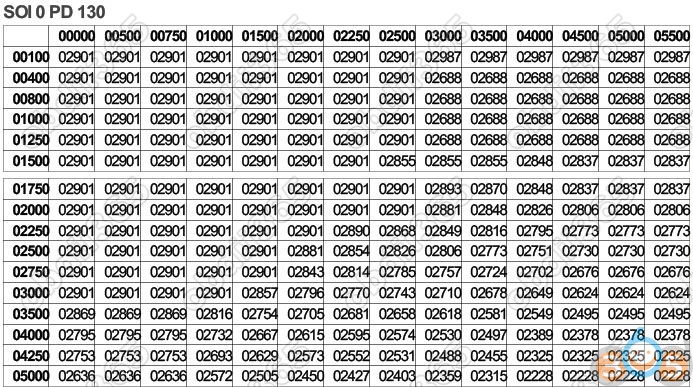
START OF INJECTION 0 (SOI 0)
First row (X) is I.Q (0 – 5500) Multiply by 0.01 to see it as I.Q in mg/stroke. (5500 x 0.01 = 55 mg/stroke)
First column is engine rpm (0 – 5000)
Chart data (Z) is Crankshaft rotation. Multiply by 0.02347 to see it as degrees of crankshaft rotation. (2901 x 0.023437 = 67.99 degrees)
If you want to see this expressed as degrees Before Top Dead Centre (BTDC) You must take the degree answer from 78. (78 – 67.99 =
10.01 degrees BTDC).
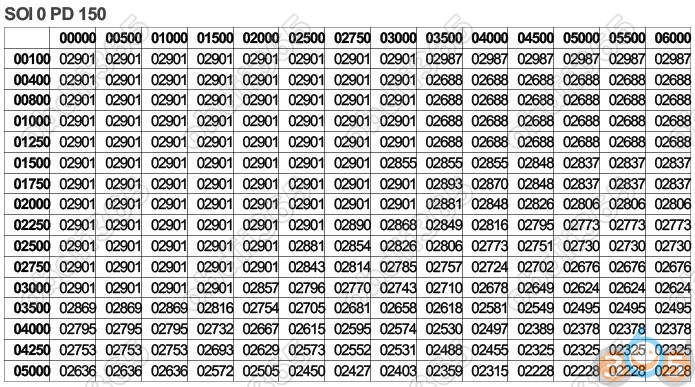
Duration and SOI maps are very hard to interpret.
The % difference chart for SOI 0, pd 130 vs pd 150 shows almost no difference. All ten SOI maps show the same change.
All ten have the X – axis changed to allow more fuel to be injected. The I.Q allowed on the axis has increased from 50 mg/stroke to 55
mg/stroke.
This has been achieved by removing the 7.5 mg/stroke column, moving all the other columns one column to the left and adding an extra 55
mg/stroke column at the end.
The timing of injection is advanced slightly by moving the columns one place to the left. So more fuel can be injected by starting injection
slightly earlier.
This brings two benifits.
More power from more fuel and more power due to advance in timing of start of injection.
At this point, the fuelling is sorted and as you can see, it has not been altered by much.
The next area for improvement is the air supply. (Turbocharger)
The Turbocharger consists of three maps.
A desired turbocharger pressure map
A turbocharger control valve map.
A turbocharger pressure limiting map
A turbocharger Single Value Pressure Limiter.
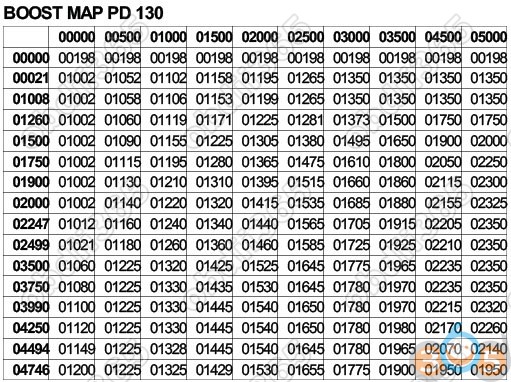
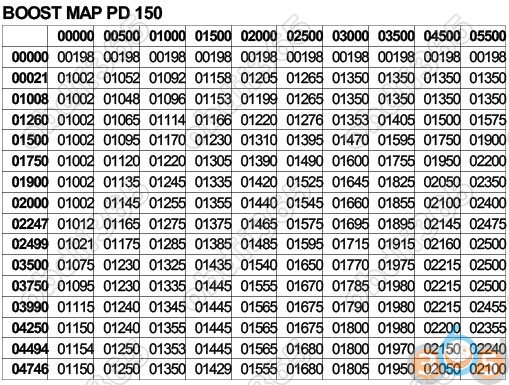
TURBOCHARGER BOOST PRESSURE MAP.
First row (X) is Injection Quantity (I.Q) (0 – 5000). Multiply by 0.01 to see it as mg/stroke. (5000 x 0.01 = 50 mg/stroke)
First column (Y) is engine RPM. (0 – 4746)
Chart data (Z) is required boost pressure. (0 – 2350 mbars)
![]()
The % difference chart shows that the I.Q axis has been changed for the 150 to allow I.Q to reach 55 mg/stroke instead of 50 mg/stroke of the
130.
The chart data is a little different at middle RPM & I.Q. The main difference is the last column where boost is allowed to rise.
Maximum boost of 2350 mbar for the 130 is raised to a maximum of 2500 mbar in the 150.
Most of the boost changes occur above 1500 rpm as this is when the turbocharger starts to spool up.
TURBOCHARGER CONTROL VALVE MAP. (N75 % DUTY CYCLE)
This map controls the action of the turbocharger via the N75 solenoid and the turbocharger vacuum actuator.
First row (X) is Injection Quantity (I.Q) (0 – 5800). Multiply by 0.01 to see it as mg/stroke. (5800 x 0.01 = 58 mg/stroke)
First column (Y) is engine RPM. (0 – 4242)
Chart data (Z) is N75 duty cycle. (0 – 8000). Multiply by 0.01 to see it as % duty cycle. (8000 x 0.01 = 80 %)
80% is turbo vanes positioned for maximum boost. Approximately 20% is turbo vanes positioned for zero boost
The % difference chart shows the axes are unchanged between the pd 130 and pd 150.
There is little difference below 1500 RPM as the turbocharger is not working even though it is set for maximum boost (80%)
At roughly 1500 rpm, exhaust pressure spools the turbocharger up to speed and boost increases.
For the 130 boost will head towards it’s limit of 2350 mbars and on the 150 it will head towards it’s limit of 2500 mbars.
For the 130 boost will head towards it’s limit of 2350 mbars and on the 150 it will head towards it’s limit of 2500 mbars.
The trubocharger is already set for maximum boost so the job of the N75 Duty cycle is to change the vane angle in the turbocharger, to reduce
boost.
The % difference chart shows that the 150 reduces boost LESS tan the 130 and so the boost pressure is kept higher in the 150.
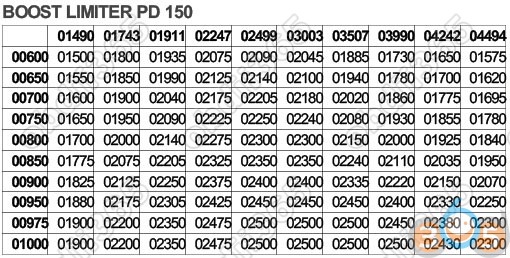
BOOST LIMITING MAP.
Turbocharger boost is limited by an atmospheric air pressure map and by a single maximum Single Value Boost Limit (SVBL).
First row(X) is engine rpm. (0 – 4494)
First column (Y) is Atmospheric Air Pressure.(600 – 1100 mbars)
This map is designed to limit boost when the air pressure is less than ideal. (Ideal is taken as 1000 mbars.) At low air pressure, the air is
thinner so the turbocharger cannot compress enough air and will spin too fast as it tries. This will damage the turbocharger bearings.

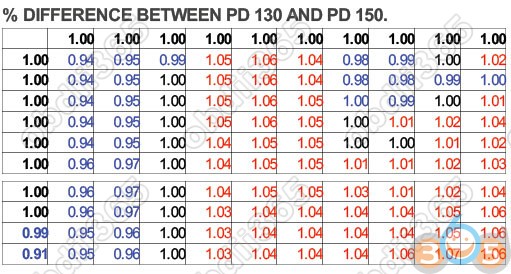
The % difference chart shows that the 150 allows slightly higher (up to 6%) boost at middle to high rpm, so the 150 is slightly less turbo
limiting.
So the 20 BHP increase from 130 to 150 bhp is mainly achieved by increasing the Injected Quantity slightly and increasing the turbocharger
boost slightly.
Obviously the designers feel that this extra 20 bhp is not too much strain for the engine.
It is possible to increase bhp beyond 150 bhp. Many engine tuners claim to remap 1.9 pd tdi diesels from 130 to almost 180 bhp.
The more power you try to extract, the more fuel you will use and the more strain you will put on the engine, clutch and gearbox
An .xls spreadsheet (raw data) version of the information above can be downloaded by clicking the blue arrow below.
Disclaimer: This is a copy version, not originated from obdii365.com. Thought it helpful and share tutorial again.
If you need winols crack software, please contact us via Email: Sales@OBDII365.com